

The 2026 Senate results show a broad Democratic shift when compared with the 2024 presidential vote. Of 35 Senate races, 33 had been projected, and Democrats won 20 of them; seven states flipped Republican-held seats, including eight Democratic wins in states Trump carried in 2024. Democratic Senate winners’ average margins were twice Harris’s 2024 margins in those states, while Republican winners’ average margins were half Trump’s. State examples show how the pattern varied: Republicans won in West Virginia, Alabama, and Florida, but by smaller margins than Trump had, while Democrat Jack Reed won Rhode Island by more than Harris had. Alaska and Mississippi remained toss-ups, and the reported Florida count was dated Nov. 4, with 99 percent of votes in. The figures show results, not why voters made their choices.
TLDR: The reported 2026 results put Democrats in control of both congressional chambers and show Senate gains across states that had favored Trump in 2024. The comparison of margins points to a broad shift toward Democratic Senate candidates, though two races remained toss-ups in the available account.
The 2026 midterm results show a broad Democratic shift in Senate races, measured against the 2024 presidential vote. The reported figures point to more than a handful of close contests: Democrats won seats in several states carried by Donald Trump in 2024, and Senate margins moved toward Democrats across states that changed party control. Charts comparing the two elections show the scale and direction of that change, but they do not explain what caused it.
The election material gives no official rationale for the shift. It reports results and compares Senate margins with the 2024 presidential vote. Those comparisons show how outcomes differed between elections; they do not establish why voters made their choices. The figures also do not separate the effects of candidate, campaign, turnout, or other factors.
Of the 35 Senate races on the 2026 ballot, 33 had been projected at the time of the report. Democrats won 20 of those projected races. Eight Democratic victories came in states that voted for Trump in 2024. Seven states changed party control of a Senate seat, with each reported switch moving from Republican to Democratic. Alaska and Mississippi remained toss-ups in the reported account, so the overall picture was not fully settled.
The first chart comparison is the overall Senate count. It shows Democrats winning most of the races that had been projected, while two contests remained unresolved. That count describes the reported results, not a final outcome for every state. The distinction matters when reading a map or tally: projected races can show a clear direction, while outstanding contests still leave some uncertainty in the total.
A second comparison looks at Senate margins alongside the presidential margins from 2024. In states where Democrats won Senate races, their average winning margins were twice as large as Kamala Harris’s winning margins in those states in 2024. In states where Republicans won Senate races, their average margins were half as large as Trump’s 2024 margins. These averages summarize broad patterns. They do not mean that every state moved by the same amount, or that the Senate candidates and presidential candidates faced identical contests.
The state-by-state examples make the contrast easier to see. In West Virginia, Trump won by 42 percentage points in 2024. Republican incumbent Sen. Shelley Moore Capito won her 2026 Senate race by about 20 points. The Republican candidate still won, but the reported margin was roughly half the earlier presidential margin. The chart therefore shows a smaller Republican advantage in the Senate contest, not a Democratic win in the state.
Alabama also had a much narrower Republican Senate result than its presidential result. Barry Moore won his Senate race by about nine points, while Trump carried Alabama by more than 30 points in 2024. Those figures mark a large difference in margin. They do not show which voters changed their choices, whether different groups turned out, or what issues shaped the result.
Florida provides another comparison. Trump won the state by 13 points in 2024, while Republican Sen. Ashley Moody won reelection by three points in 2026. The reported snapshot was dated Nov. 4, when 99 percent of votes were in. That timing and vote count help explain what the chart captures: a close Senate result in the reported returns compared with a much wider presidential margin two years earlier.
Some Democratic results moved in the other direction, with Senate candidates winning by more than the party’s presidential candidate had. In Rhode Island, Harris won by about 14 points in 2024, while Democratic Sen. Jack Reed won reelection by 37 points in 2026. That state-level example fits the reported average for Democratic Senate winners. It also shows why one chart should be read alongside individual results: averages give a summary, while state comparisons show how varied the margins can be.
Taken together, the figures describe a broad Democratic shift in Senate outcomes. Democrats gained seven Republican-held seats, and eight of their victories came in states Trump had carried. Republican Senate candidates still won in states including West Virginia, Alabama, and Florida, but their reported margins were smaller than Trump’s earlier margins there. In Rhode Island, Reed’s Senate margin was much larger than Harris’s. The charts show both the direction of change and the fact that its size differed by state.
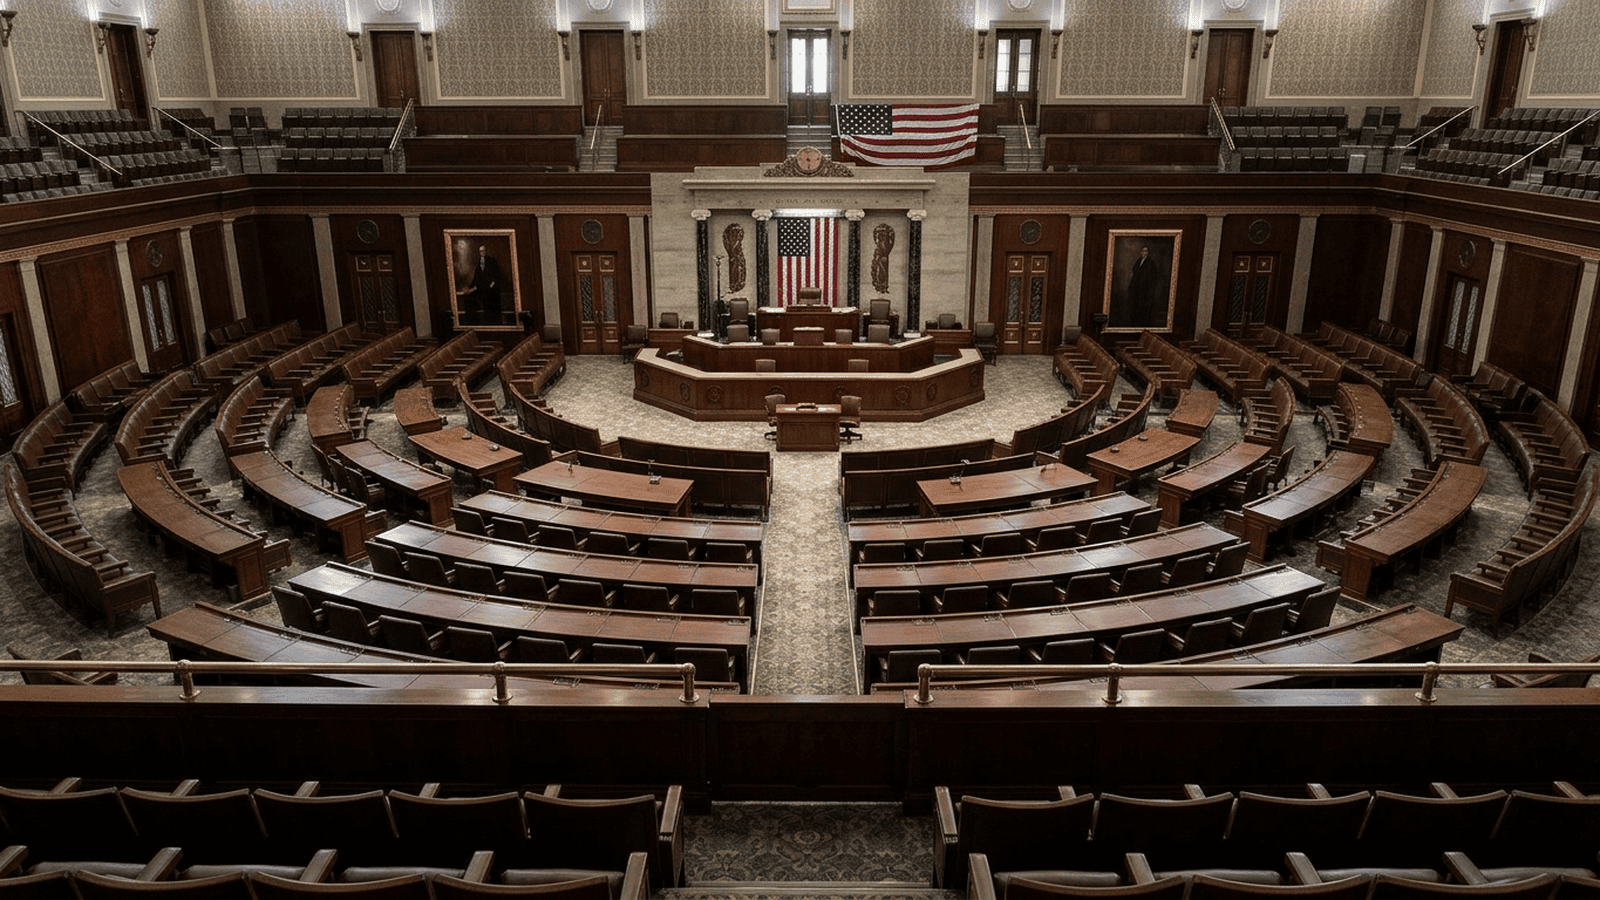
The reported institutional impact is that Democrats are set to control both the Senate and the House of Representatives after the midterms. The election material does not describe specific policy changes, legislative consequences, costs, new paperwork, enforcement changes, or timelines. It therefore supports a statement about reported control of Congress, but not a prediction about what that control will mean for particular laws or programs.
The figures remain a snapshot of the report’s projection status and vote count. Thirty-three Senate races had been projected, while Alaska and Mississippi remained toss-ups. Those outstanding contests should be kept in view when reading the overall tally. The charts establish where the reported margins differed from 2024 and which party gained seats; they do not provide a complete account of voter behavior or the reasons behind the shift.

Lila Hayes serves as a Staff Writer for Just Right News, where she anchors the “Courts, Law, and Constitutional Order” beat. Her work is defined by a steadfast commitment to the foundational principles of the American republic and a rigorous defense of the legal frameworks that ensure national stability. As a primary voice for the outlet, she provides readers with a clear-eyed analysis of the judiciary, focusing on the importance of originalism and the preservation of the separation of powers.
Lila’s perspective was forged in the American heartland. Raised in St. Louis, Missouri, she grew up in a Hispanic household where the values of hard work, faith, and respect for the law were paramount. Her upbringing instilled in her a deep appreciation for the American Dream and the legal protections that make it possible. This Missouri background remains a cornerstone of her reporting, providing a grounded, common-sense counter-narrative to the often-insular legal circles of the coastal elite. She understands that the decisions made in high-court chambers have real-world consequences for families and small business owners across the country.
At Just Right News, Lila has become widely recognized for her signature feature series, “The Rulebook of Power.” In this ongoing project, she delves into the mechanics of the federal government, examining how administrative overreach and judicial activism can threaten the delicate balance of the Constitution. She approaches her beat with the tenacity of a veteran journalist and the precision of a legal scholar, consistently advocating for a judiciary that interprets the law as written rather than legislating from the bench. For Lila, the Constitution is not a “living” document subject to the whims of modern social trends; it is a fixed standard that ensures the government remains the servant of the people, not their master.
Now based in Philadelphia, Pennsylvania, Lila finds herself at the very epicenter of American constitutional history. Living and working in the city where the Founders drafted the documents she defends daily provides a constant source of inspiration. The historic halls and landmarks of Philadelphia serve as a daily reminder of the high stakes involved in her reporting. Her presence in the city allows her to bridge the gap between the historical intent of the law and its contemporary application, ensuring that the legacy of the Founding Fathers remains central to the national conversation.
Throughout her career, Lila has remained dedicated to the idea that a free society requires an informed citizenry and a transparent legal system. Her reporting is more than just a collection of headlines; it is a defense of the constitutional order that has sustained the nation for over two centuries. By focusing on the “Rulebook of Power,” she ensures that her readers understand not just what is happening in the courtrooms, but why those decisions matter for the future of American liberty. Lila Hayes continues to be a vital voice for those who believe that the law should be a shield for the citizen and a constraint on the state.